 |
||||
| Northwest Rhode Island Tea Party |
||||
| Home | Contact Us | |||
|
||||
| Northwest Rhode Island Tea Party |
||||
| Home | Contact Us | |||
Sign up to receive updates from the North Western RI Tea Party Open to the Public - The Northwest RI Tea Party usually meets monthly in or near the Village of North Scituate, in the early evening for approximately one and one half hour. We represent Burrillville, Foster, Glocester, Scituate, Smithfield, and N. Smithfield Typically there are 1-3 speakers drawn from RI Gen'l Assembly, Tea Party, local business, etc. as well as video and audio presentations. Bring a friend. For more details about each month's agenda subscribe here. |
|||
...no man may initiate the use of physical force against others. No manor group or society or governmenthas the right to assume the role of a criminal and initiate the use of physical compulsion against any man. Men have the right to use physical force only in retaliation and only against those who initiate its use. The ethical principle involved is simple and clear-cut: it is the difference between murder and self-defense. A holdup man seeks to gain a value, wealth, by killing his victim; the victim does not grow richer by killing a holdup man. The principle is: no man may obtain any values from others by resorting to physical force. Ayn Rand |
|||
State Legislative Officials From The NWTP Area |
|||
Burrillville Foster Scituate Glocester Smithfield N. Smithfield |
|||
| (top of page) | |||
Highlights |
|||
| Next Meeting: |
|||
Tuesday |
|||
| Ayn Rand’s “Atlas Shrugged” Named One of 88 “Books That Shaped America” | |||
| Fifty-Five Years after Publication,
Rand’s Novel Recognized by Library of Congress Press Release from the Ayn Rand Institute |
|||
| Don't attribute success to "somebody" | |||
| President ignores individuals who built America and principles upon which they built it. Article from the Orange County Register |
|||
| Obama And Romney Are Wrong: Outsourcing Is America At Its Best | |||
| Article from Forbes | |||
| Two New Articles | |||
| One-Robin Hoods Don't Smash Shop Windows Two-Immoral Beyond Redemption |
|||
| What are Rights? | |||
| You Can't Defend Your Rights Unless You Know What Rights Are | |||
| Unemployment Statistics | |||
| A picture (or spreadsheet graph) is worth a thousand words. An example of how to use government statistics to disprove government statistics. (Courtesy of our NW Tea Party resident statistician with a black belt in spreadsheet weaponry a.k.a. LeoRI) | |||
| Bad Words | |||
| Some words we use that hurt individual rights. | |||
| America Before The Entitlement State | |||
| "If Americans could thrive without an entitlement state a century ago, how much easier would it be today, when Americans are so rich that 95 percent of our poor own color TVs?" Article From Forbes |
|||
| Activism From Your Couch | |||
| How to protect individual rights without leaving the comfort of your own home. | |||
| Recommended Reading | |||
| Link | |||
| (top of page) | |||
|
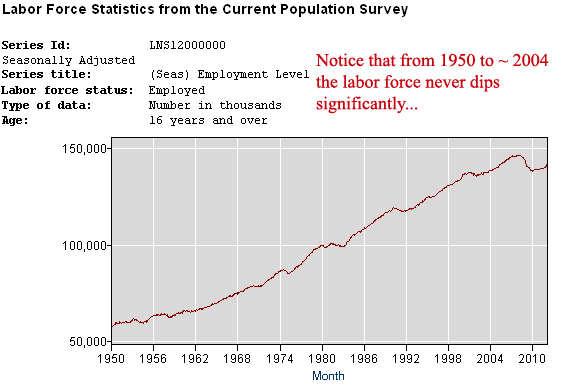
Labor Force vs Unemployment:
|
||||
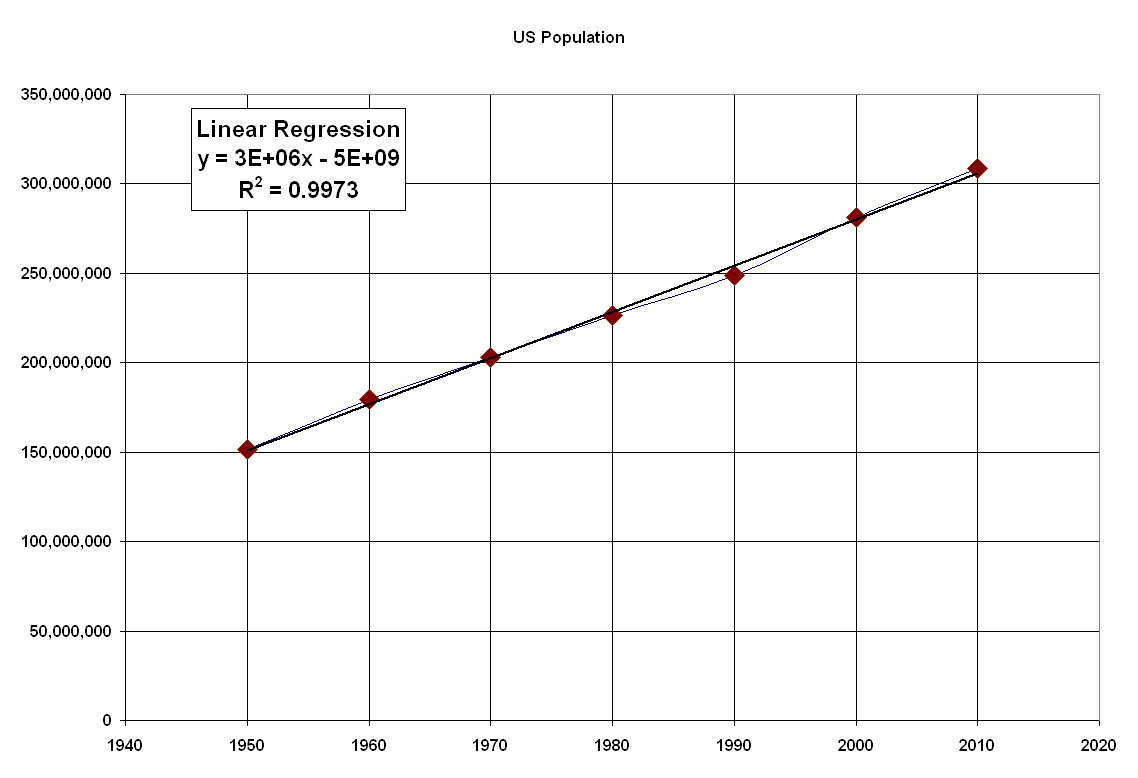
I have been hearing various commentators talk about how the unemployment stats may be bogus. So, I decided to take a look for myself. All of the labor statistics can be found on the government web site for the Bureau of Labor Statistics (LINK) The following graphs show theLabor Force: (y-axis is in thousands) From 1950 to 2012 |
||||
 |
||||
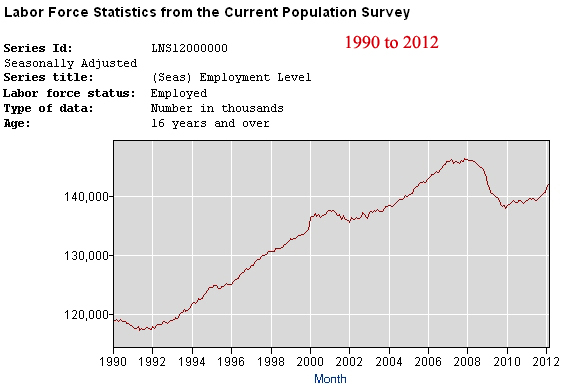
| From 1990 to 2012 | ||||
 |
||||
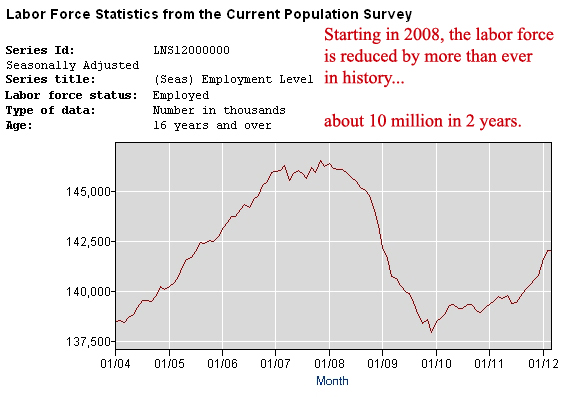
| From 2004 to 2012 | ||||
 |
||||
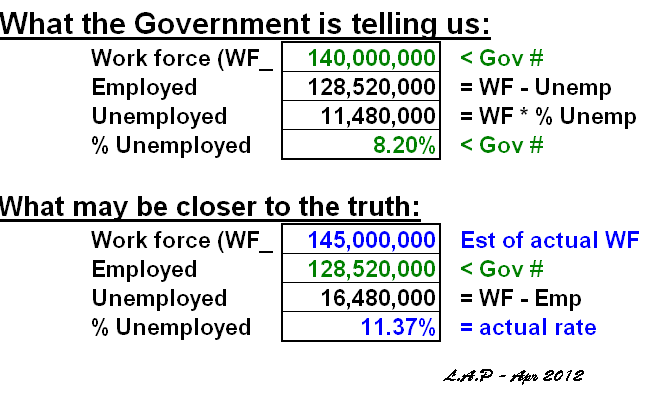
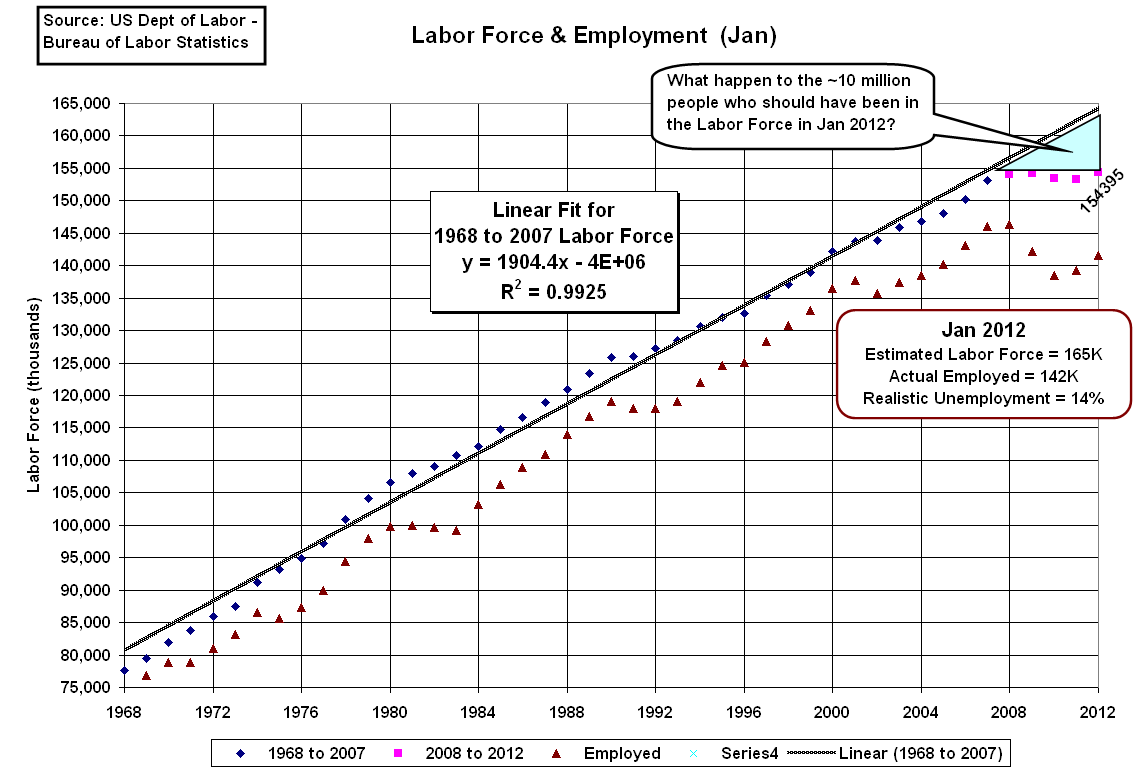
| Using that information, I used Excel to do the following analysis: Note that I used a conservative estimate for the actual workforce. If I used 150 million, the unemployment rate is over 14% |
||||
 |
||||
| Conclusion is that they are cooking the books and thus lying to us. By decreasing the workforce number, they make unemployment look better than it really is. | ||||
But there's more . . . |
||||
| Over the past 60 years, our population has grown at about 3 million people per year. So, the graph showing the workforce growing at about 2 million per year makes sense. So, where did they disappear to starting in Jan 2007? | ||||
 |
||||
| Note that for the following graph, the regression has an R2 of .9925 which says that for 39 years, the labor force numbers are 99.25% explained by the simple annual growth. Also, calculated that the labor force from 1968 to 2007 grew at 1.9 million per year. For easier viewing select "view" and then "zoom" from your browser's menu bar. |
||||
 |
||||
|
||||
